Silence before the Storm
Here's an analogy to describe the precarious situation we're in. When heat is added to water at boiling point (100°C or 212°F), vapor will appear at the surface, while bubbles of gas are formed throughout the water, but the water's temperature will not rise. All added energy is absorbed in the water, transforming it from a liquid to a gas. This is illustrated by the image below, adapted from ilpi.com.
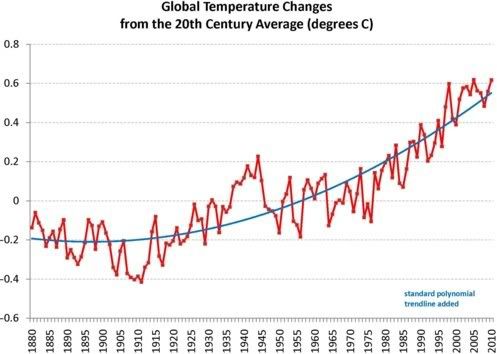
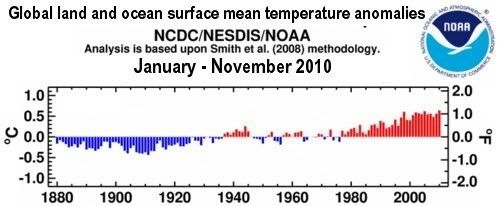
 Similarly, Earth is now at boiling point, i.e. the situation has reached a point where - at first glance - it may appear as if there's little or no change. Rises in global temperature, as illustrated by the chart below, based on data by the National Oceanic and Atmospheric Administration (NOAA) with standard polynomial trendline added, may seem only mild.
 Many will hardly notice global warming, due to the variability of short-term weather conditions locally.
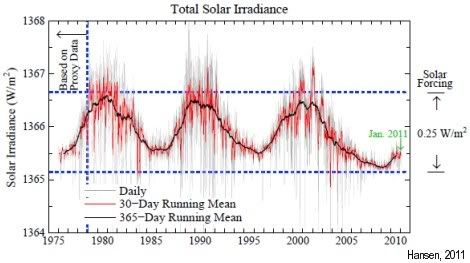
Furthermore, we’ve had a strong La Niña, which pushes temperatures down, while we’ve been in a solar minimum, as some call it: “the deepest solar minimum in nearly a century”.
As the image on the right shows, differences in irradiation can amount to a difference in warming of up to 0.25 W/m2.
So, impressions that the impact of global warming was only mild can be deceptive.
The NOAA image below shows a steady increase in carbon dioxide over the years. At the same time, the image also shows little or no increase at all for some other emissions over the past decade, particularly for methane (CH4).
Many will hardly notice global warming, due to the variability of short-term weather conditions locally.
Furthermore, we’ve had a strong La Niña, which pushes temperatures down, while we’ve been in a solar minimum, as some call it: “the deepest solar minimum in nearly a century”.
As the image on the right shows, differences in irradiation can amount to a difference in warming of up to 0.25 W/m2.
So, impressions that the impact of global warming was only mild can be deceptive.
The NOAA image below shows a steady increase in carbon dioxide over the years. At the same time, the image also shows little or no increase at all for some other emissions over the past decade, particularly for methane (CH4).
 Again, such impressions can be deceptive, as this may make people assume that methane will continue to show little or no increase in future. Instead, the boiling-point analogy is more appropriate to describe the situation regarding methane. Similar to bubbles that start forming in water at boiling point, methane bubbles are forming in the Arctic.
Arctic Sea Ice losses
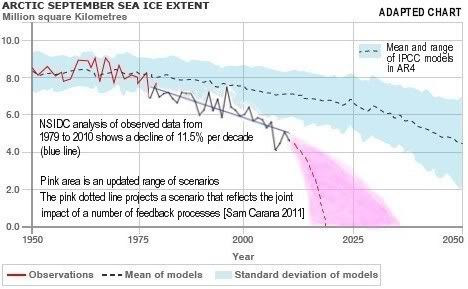
At the European Geosciences Union annual meeting, Professor Wieslaw Maslowski, who works at Naval Postgraduate School in Monterey, California, unveiled the results of advanced computer modeling that produces a "best guess" date of 2016 for Arctic waters to be ice-free in summers. The study follows his team's 2007 projection that the dramatic loss of ice extent in 2007 set the stage for Arctic waters to be ice-free in summers within just 5-6 years.
Also illustrative is the image below, from Arctic Sea Ice Blog.

Feedback Effects in the Arctic
Disappearing sea ice will cause albedo changes in the Arctic, amplifying the warming taking place there. The color of the sea is darker than the ice that previously covered it.
 Another albedo change is taking place on land. The forested landscape in Siberia may over the course of a year absorb between 2 and 7% more solar radiation, reinforcing local warming trends.
Temperature rises are further amplified by additional feedback effects such as releases of nitrous oxide and methane.
So, while it may appear that there has been little or no rise in methane for some time, the prospect of future methane emissions looks very scary.
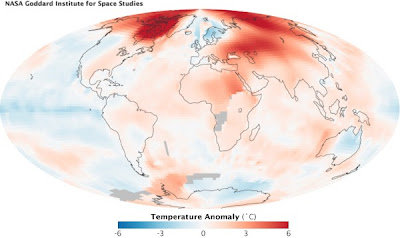
Due to amplification of global warming in the Arctic, temperatures can now be 10°C or 18°F higher than average temperatures were 1951-1980 (NASA image left)..
Most methane emissions occur at the northern hemisphere's high latitudes (Wikipedia image below).
Another albedo change is taking place on land. The forested landscape in Siberia may over the course of a year absorb between 2 and 7% more solar radiation, reinforcing local warming trends.
Temperature rises are further amplified by additional feedback effects such as releases of nitrous oxide and methane.
So, while it may appear that there has been little or no rise in methane for some time, the prospect of future methane emissions looks very scary.
Due to amplification of global warming in the Arctic, temperatures can now be 10°C or 18°F higher than average temperatures were 1951-1980 (NASA image left)..
Most methane emissions occur at the northern hemisphere's high latitudes (Wikipedia image below).

 At first glance, it may seem as if there's nothing to worry about. Methane releases have historically been stronger at high latitudes of the northern hemisphere, as illustrated by the NOAA image left (with Mauna Loa data highlighted in red).
However, levels of methane in the Arctic can be expected to rise dramatically, as discussed below.
The image below shows the current extent of Arctic permafrost, as part of a study by Edward Schuur that estimates that there is some 1672 petagrams (GT or billion metric tons, see table below) of carbon in the Arctic permafrost - roughly equivalent to a third of all carbon in the world's soils and about twice the amount of carbon contained in the atmosphere.
At first glance, it may seem as if there's nothing to worry about. Methane releases have historically been stronger at high latitudes of the northern hemisphere, as illustrated by the NOAA image left (with Mauna Loa data highlighted in red).
However, levels of methane in the Arctic can be expected to rise dramatically, as discussed below.
The image below shows the current extent of Arctic permafrost, as part of a study by Edward Schuur that estimates that there is some 1672 petagrams (GT or billion metric tons, see table below) of carbon in the Arctic permafrost - roughly equivalent to a third of all carbon in the world's soils and about twice the amount of carbon contained in the atmosphere.

The figures mentioned in above paragraph were also used in the report by the Copenhagen Diagnosis, where authors further pointed at the amplifying feedback effect in high northern latitudes of microbial transformation of nitrogen trapped in soils to nitrous oxide.
Apart from Arctic releases of carbon dioxide, there is the potential for releases of nitrous oxide and methane. Much methane is also present in Arctic waters and in sediments underneath the water. Due to methane's high initial global warming potential (GWP), large abrupt releases of methane could lead to runaway global warming, as further discussed below.
The terrifying prospect is that, within a time-span of only a few years, huge methane releases in the Arctic will spread around the globe, covering Earth in a heat-trapping blanket and moving our biosphere beyond its biological boiling point.
Units of measurement
Multiple Name Symbol
English Multiple (SI) Name (SI) Symbol (SI) English(SI) 100 gram g gram 103 kilogram Kg thousand g 100 tonne t 1 tonne 106 megagram Mg million g 103 kilotonne kt 1 thousand tonnes 109 gigagram Gg billion g 106 megatonne Mt 1 million tonnes 1012 teragram T trillion g 109 gigatonne Gt 1 billion tonnes 1015 petagram Pg quadrillion g 1012 teratonne Tt 1 trillion tonnes 1018 exagram Eg 1015 petatonne Pt 1 quadrillion tonnes 1021 zettagram Zg 1018 exatonne Et 1024 yottagram Yg
Methane's Global Warming Potential (GWP)
The image below, from the Intergovernmental Panel on Climate Change (IPCC), shows that methane levels have already been rising dramatically since the industrial revolution.

Over the years, the IPCC has upgraded methane's global warming potential (GWP). In 1995, the IPCC used a figure of 56 for methane's GWP over 20 years, i.e. methane being 56 times more powerful than carbon dioxide by weight when comparing their impact over a period of 20 years. In 2001, the IPCC upgraded methane's GWP to 62 over 20 years, and in 2007 the IPCC upgraded methane's GWP to 72 over 20 years.
Large releases could make that much of the methane could remain in the atmosphere longer, without getting oxidized. Initially, much of the methane is oxidized in the sea by oxygen (when released from underwater sediments) and in the atmosphere by hydroxyl. Over time, however, accumulation of methane could cause oxygen and hydroxyl depletion, resulting in ever more methane entering the atmosphere and remaining there for a longer period.
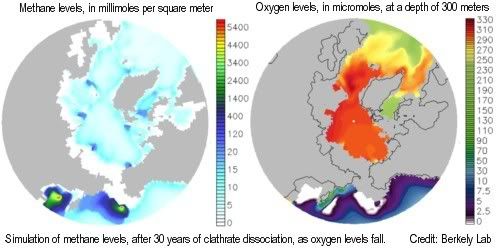
A two-part study by Berkeley Lab and Los Alamos National Laboratory shows that, as global temperature increases and oceans warm, methane releases from clathrates would over time cause depletion of oxygen, nutrients, and trace metals needed by methane-eating microbes, resulting in ever more methane escaping into the air unchanged, to further accelerate climate change.
A 2009 study by Drew Shindell et al. shows that chemical interactions between emissions cause more global warming than previously estimated by the IPCC. The study shows that increases in global methane emissions have already caused a 26% decrease in hydroxyl (OH). Because of this, methane now persists longer in the atmosphere, before getting transformed into the less potent carbon dioxide.
A Centre for Atmospheric Science study suggests that sea ice loss may amplify permafrost warming, with an ice-free Arctic featuring a decrease in hydroxyl of up to 60% and an increase of tropospheric ozone (another greenhouse gas) of up to 60% over the Arctic.
Extension of methane's lifetime further amplifies its greenhouse effect, especially for releases that are two or three times as large as current releases.
 The graph on the right, based on data by Isaksen et al. (2011), shows how methane's lifetime extends as more methane is released.
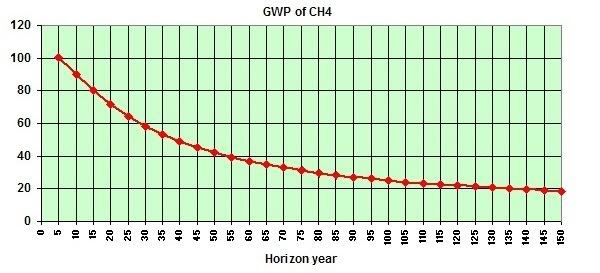
The image below, from a study by Dessus et al., shows how the impact of methane decreases over the years. In the first five years after its release, methane will have an impact more than 100 times as potent as a greenhouse gas compared to carbon dioxide.
The graph on the right, based on data by Isaksen et al. (2011), shows how methane's lifetime extends as more methane is released.
The image below, from a study by Dessus et al., shows how the impact of methane decreases over the years. In the first five years after its release, methane will have an impact more than 100 times as potent as a greenhouse gas compared to carbon dioxide.
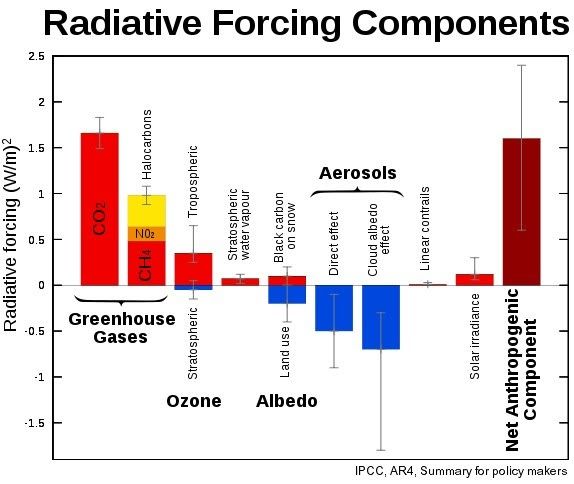
 The GWP for methane typically includes indirect effects of tropospheric ozone production and stratospheric water vapor production. The study by Isaksen et al. shows (image below) that a scenario of 7 times current methane levels (image below,medium light colors) would correspond with a radiative forcing of 3.6 W/m-2.

Such an increase in methane would thus add more than double the entire current net anthropogenic warming (for comparison, see Wikipedia image below).
For many years, the amount of methane has remained stable at about 5 Gt annually (NOAA image below). A scenario of 7x this amount would lift the amount of methane in the atmosphere to about 35 Gt.
 A scenario of seven times the amount of methane we're used to having in the atmosphere would give the methane a lifetime of more than 18 years, so there's no relief from this burden in sight, while this would triple the entire net effect of all emissions added by people since the industrial revolution.
Arctic concentration makes the situation even worse
 What makes things even worse is that all this methane would initially be concentrated in the Arctic, whereas GWP for greenhouse gases is typically calculated under the assumption that the respective greenhouse gas is spread out globally.
All this methane will initially be concentrated locally, causing huge Arctic amplification of the greenhouse effect in summer, when the sun doesn't set.
The methane will heat up the sea, causing further lack of of oxygen in the water, while algae start to bloom, making this worse, and lack of hydroxyl in the air.
In a vicious circle that will further accelerate the permafrost melt, this will cause further releases from permafrost and clathrates.
What makes things even worse is that all this methane would initially be concentrated in the Arctic, whereas GWP for greenhouse gases is typically calculated under the assumption that the respective greenhouse gas is spread out globally.
All this methane will initially be concentrated locally, causing huge Arctic amplification of the greenhouse effect in summer, when the sun doesn't set.
The methane will heat up the sea, causing further lack of of oxygen in the water, while algae start to bloom, making this worse, and lack of hydroxyl in the air.
In a vicious circle that will further accelerate the permafrost melt, this will cause further releases from permafrost and clathrates.
Uninhabitable Planet
Back in 2009, I pointed at projections of a MIT study showing that, without rapid and dramatic action on global warming, global median surface temperature will rise by 9.4oF (5.2oC) by 2100.
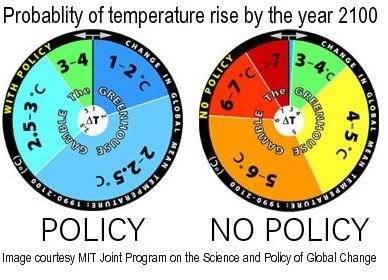 The wheel on the right depicts the MIT's estimate of the range of probability of potential global temperature rise by 2100 if no policy is enacted on curbing greenhouse gas emissions.
The wheel on the left assumes that aggressive policy is enacted, and projects a lower rise.
The projections show rises ranging up to 13.3oF (7.4oC), based on probabilities revealed by 400 simulations.
But even the worst-case scenario in the above MIT-study may actually understate the problem and the speed with which this may eventuate, since the model does not fully incorporate positive feedbacks such as large-scale melting of permafrost in arctic regions and subsequent release of large quantities of methane.
Several teams of scientists warn that we can expect a rise of 4oC within decades. A rapid rise in temperature is likely to make the areas where most people now live uninhabitable, leaving humans, mammals and plants little on no time to migrate to cooler areas. The image below (edited from New Scientist) shows that the currently inhabited part of the planet would become largely uninhabitable with a global temperature rise of 4oC.
The wheel on the right depicts the MIT's estimate of the range of probability of potential global temperature rise by 2100 if no policy is enacted on curbing greenhouse gas emissions.
The wheel on the left assumes that aggressive policy is enacted, and projects a lower rise.
The projections show rises ranging up to 13.3oF (7.4oC), based on probabilities revealed by 400 simulations.
But even the worst-case scenario in the above MIT-study may actually understate the problem and the speed with which this may eventuate, since the model does not fully incorporate positive feedbacks such as large-scale melting of permafrost in arctic regions and subsequent release of large quantities of methane.
Several teams of scientists warn that we can expect a rise of 4oC within decades. A rapid rise in temperature is likely to make the areas where most people now live uninhabitable, leaving humans, mammals and plants little on no time to migrate to cooler areas. The image below (edited from New Scientist) shows that the currently inhabited part of the planet would become largely uninhabitable with a global temperature rise of 4oC.
 Above image gives some suggestions as to action that can be taken, such as reforestation and construction of clean energy facilities. The image also shows that habitable areas may be restricted to the edges of the world where there's little sunshine. A specific area can become uninhabitable due to sea level rises or heat stress. Humans simply cannot survive prolonged exposure to temperatures exceeding 95°F (35°C), explains Steven Sherwood. An area can also become uninhabitable due to recurring wildfires, floods, droughts, storms and further extreme weather events that cause erosion, desertification, crop losses and shortages of fresh water.
Back in 2007, I pointed at the danger of tipping points beyond which human beings face the risk of total extinction, particularly if many species of animals and plants that humans depend on will disappear. The boiling point analogy shows that there may be a window of time to act, like a silence before the storm. This realization should prompt us to speed up implementation of the necessary policies while we can. In fact, abrupt large releases of methane may close that window rather quickly, as described in Runaway Global Warming and The potential for methane releases in the Arctic to cause runaway global warming.
Above image gives some suggestions as to action that can be taken, such as reforestation and construction of clean energy facilities. The image also shows that habitable areas may be restricted to the edges of the world where there's little sunshine. A specific area can become uninhabitable due to sea level rises or heat stress. Humans simply cannot survive prolonged exposure to temperatures exceeding 95°F (35°C), explains Steven Sherwood. An area can also become uninhabitable due to recurring wildfires, floods, droughts, storms and further extreme weather events that cause erosion, desertification, crop losses and shortages of fresh water.
Back in 2007, I pointed at the danger of tipping points beyond which human beings face the risk of total extinction, particularly if many species of animals and plants that humans depend on will disappear. The boiling point analogy shows that there may be a window of time to act, like a silence before the storm. This realization should prompt us to speed up implementation of the necessary policies while we can. In fact, abrupt large releases of methane may close that window rather quickly, as described in Runaway Global Warming and The potential for methane releases in the Arctic to cause runaway global warming.
Here's an analogy to describe the precarious situation we're in. When heat is added to water at boiling point (100°C or 212°F), vapor will appear at the surface, while bubbles of gas are formed throughout the water, but the water's temperature will not rise. All added energy is absorbed in the water, transforming it from a liquid to a gas. This is illustrated by the image below, adapted from ilpi.com.
Many will hardly notice global warming, due to the variability of short-term weather conditions locally.Arctic Sea Ice losses
At the European Geosciences Union annual meeting, Professor Wieslaw Maslowski, who works at Naval Postgraduate School in Monterey, California, unveiled the results of advanced computer modeling that produces a "best guess" date of 2016 for Arctic waters to be ice-free in summers. The study follows his team's 2007 projection that the dramatic loss of ice extent in 2007 set the stage for Arctic waters to be ice-free in summers within just 5-6 years.
Feedback Effects in the Arctic
Disappearing sea ice will cause albedo changes in the Arctic, amplifying the warming taking place there. The color of the sea is darker than the ice that previously covered it.
Another albedo change is taking place on land. The forested landscape in Siberia may over the course of a year absorb between 2 and 7% more solar radiation, reinforcing local warming trends. At first glance, it may seem as if there's nothing to worry about. Methane releases have historically been stronger at high latitudes of the northern hemisphere, as illustrated by the NOAA image left (with Mauna Loa data highlighted in red). The figures mentioned in above paragraph were also used in the report by the Copenhagen Diagnosis, where authors further pointed at the amplifying feedback effect in high northern latitudes of microbial transformation of nitrogen trapped in soils to nitrous oxide.
Methane's Global Warming Potential (GWP)
The image below, from the Intergovernmental Panel on Climate Change (IPCC), shows that methane levels have already been rising dramatically since the industrial revolution.
Over the years, the IPCC has upgraded methane's global warming potential (GWP). In 1995, the IPCC used a figure of 56 for methane's GWP over 20 years, i.e. methane being 56 times more powerful than carbon dioxide by weight when comparing their impact over a period of 20 years. In 2001, the IPCC upgraded methane's GWP to 62 over 20 years, and in 2007 the IPCC upgraded methane's GWP to 72 over 20 years.
A 2009 study by Drew Shindell et al. shows that chemical interactions between emissions cause more global warming than previously estimated by the IPCC. The study shows that increases in global methane emissions have already caused a 26% decrease in hydroxyl (OH). Because of this, methane now persists longer in the atmosphere, before getting transformed into the less potent carbon dioxide.
A Centre for Atmospheric Science study suggests that sea ice loss may amplify permafrost warming, with an ice-free Arctic featuring a decrease in hydroxyl of up to 60% and an increase of tropospheric ozone (another greenhouse gas) of up to 60% over the Arctic.
Extension of methane's lifetime further amplifies its greenhouse effect, especially for releases that are two or three times as large as current releases.
The graph on the right, based on data by Isaksen et al. (2011), shows how methane's lifetime extends as more methane is released.
The image below, from a study by Dessus et al., shows how the impact of methane decreases over the years. In the first five years after its release, methane will have an impact more than 100 times as potent as a greenhouse gas compared to carbon dioxide.
The GWP for methane typically includes indirect effects of tropospheric ozone production and stratospheric water vapor production. The study by Isaksen et al. shows (image below) that a scenario of 7 times current methane levels (image below,medium light colors) would correspond with a radiative forcing of 3.6 W/m-2.
Such an increase in methane would thus add more than double the entire current net anthropogenic warming (for comparison, see Wikipedia image below).
For many years, the amount of methane has remained stable at about 5 Gt annually (NOAA image below). A scenario of 7x this amount would lift the amount of methane in the atmosphere to about 35 Gt.
A scenario of seven times the amount of methane we're used to having in the atmosphere would give the methane a lifetime of more than 18 years, so there's no relief from this burden in sight, while this would triple the entire net effect of all emissions added by people since the industrial revolution.
Arctic concentration makes the situation even worse
What makes things even worse is that all this methane would initially be concentrated in the Arctic, whereas GWP for greenhouse gases is typically calculated under the assumption that the respective greenhouse gas is spread out globally.
All this methane will initially be concentrated locally, causing huge Arctic amplification of the greenhouse effect in summer, when the sun doesn't set.
The methane will heat up the sea, causing further lack of of oxygen in the water, while algae start to bloom, making this worse, and lack of hydroxyl in the air.
In a vicious circle that will further accelerate the permafrost melt, this will cause further releases from permafrost and clathrates.
Uninhabitable Planet
Back in 2009, I pointed at projections of a MIT study showing that, without rapid and dramatic action on global warming, global median surface temperature will rise by 9.4oF (5.2oC) by 2100.
The wheel on the right depicts the MIT's estimate of the range of probability of potential global temperature rise by 2100 if no policy is enacted on curbing greenhouse gas emissions.
The wheel on the left assumes that aggressive policy is enacted, and projects a lower rise.
The projections show rises ranging up to 13.3oF (7.4oC), based on probabilities revealed by 400 simulations.
But even the worst-case scenario in the above MIT-study may actually understate the problem and the speed with which this may eventuate, since the model does not fully incorporate positive feedbacks such as large-scale melting of permafrost in arctic regions and subsequent release of large quantities of methane.
Several teams of scientists warn that we can expect a rise of 4oC within decades. A rapid rise in temperature is likely to make the areas where most people now live uninhabitable, leaving humans, mammals and plants little on no time to migrate to cooler areas. The image below (edited from New Scientist) shows that the currently inhabited part of the planet would become largely uninhabitable with a global temperature rise of 4oC.
Above image gives some suggestions as to action that can be taken, such as reforestation and construction of clean energy facilities. The image also shows that habitable areas may be restricted to the edges of the world where there's little sunshine. A specific area can become uninhabitable due to sea level rises or heat stress. Humans simply cannot survive prolonged exposure to temperatures exceeding 95°F (35°C), explains Steven Sherwood. An area can also become uninhabitable due to recurring wildfires, floods, droughts, storms and further extreme weather events that cause erosion, desertification, crop losses and shortages of fresh water.
Back in 2007, I pointed at the danger of tipping points beyond which human beings face the risk of total extinction, particularly if many species of animals and plants that humans depend on will disappear. The boiling point analogy shows that there may be a window of time to act, like a silence before the storm. This realization should prompt us to speed up implementation of the necessary policies while we can. In fact, abrupt large releases of methane may close that window rather quickly, as described in Runaway Global Warming and The potential for methane releases in the Arctic to cause runaway global warming.

 Arctic sea ice cover in December 2010 was the lowest on record for the month,


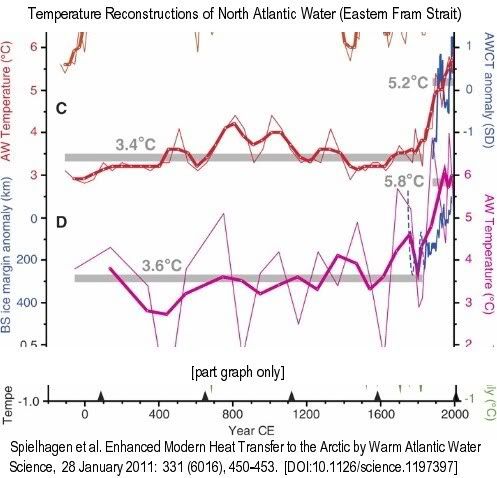 Thin lines are raw data, bold lines are three-point running means…. (C) Summer temperatures at 50-m water depth (red)…. Gray bars mark averages until 1835 CE and 1890 to 2007 CE. Blue line is the normalized Atlantic Water core temperature (AWCT) record … from the Arctic Ocean (1895 to 2002; 6-year averages)…. (D) Summer temperatures (purple) [calculated with a different method]
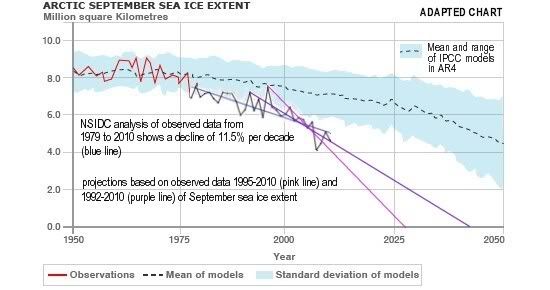