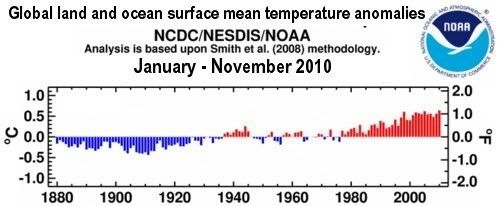
The year 2010 was the warmest year on record,
as confirmed by the WMO and as illustrated by the
NOAA graph below.
This is the more dramatic given that we’re in the middle of a strong La Niña, which pushes temperatures down, while we’ve been in “
the deepest solar minimum in nearly a century.”
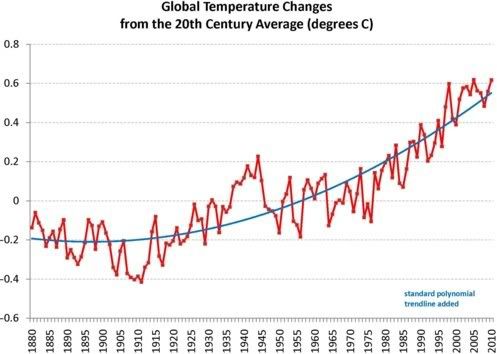
NOAA has meanwhile published the data for 2010. A
chart based on NOAA data is added below, with standard polynomial trendline added.
As the
NASA map below shows, temperature anomalies are especially prominent at higher latitudes, close to the Arctic.
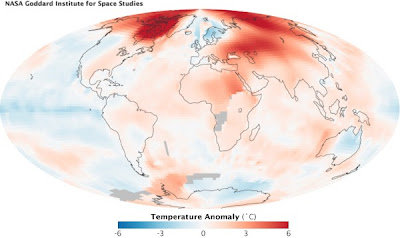
Arctic sea ice cover in December 2010 was the lowest on record for the month,
said the WMO, adding that sea ice around the northern polar region shrank to an average monthly extent of 12 million square kilometres, 1.35 million square kilometres below the 1979 to 2000 December average. Furthermore, 2011 has started with the lowest Arctic sea ice extent on record for this time of the year, as shown on the
International Arctic Research Center graph below.
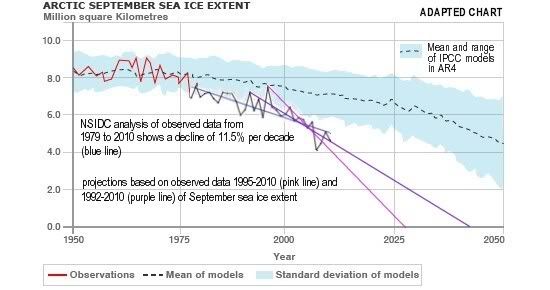
On the
NSIDC graph below, monthly September ice extent for 1979 to 2010 shows a decline of 11.5% per decade.
The NSIDC image below shows that, at the end of the summer 2010, under 15% of the ice remaining in the Arctic was more than two years old, compared to 50 to 60% during the 1980s. There is virtually none of the oldest (at least five years old) ice remaining in the Arctic (less than 60,000 square kilometers [23,000 square miles] compared to 2 million square kilometers [722,000 square miles] during the 1980s).
Why is all this so important? The Arctic sea ice acts as a giant mirror, reflecting sunlight back into space and thus keeping Earth relatively cool, as discussed in
this open letter. If this sunlight instead gets absorbed at higher latitudes, then feedback effects will take place that result in much higher temperatures, in a process sometimes referred to as Arctic amplification of global warming.
Above image is from a
recent study, which found that 2010 set a record for surface melting over the Greenland ice sheet.
The study warns that surface melt and albedo are intimately linked: as melting increases, so does snow grain size, leading to a decrease in surface albedo which then fosters further melt.
A
recent study concludes that the rate of Arctic sea ice decline appears to be accelerating due to positive feedbacks between the ice, the Arctic Ocean and the atmosphere. As Arctic temperatures rise, summer ice cover declines, more solar heat is absorbed by the ocean and additional ice melts. Warmer water may delay freezing in the fall, leading to thinner ice cover in winter and spring, making the sea ice more vulnerable to melting during the next summer.
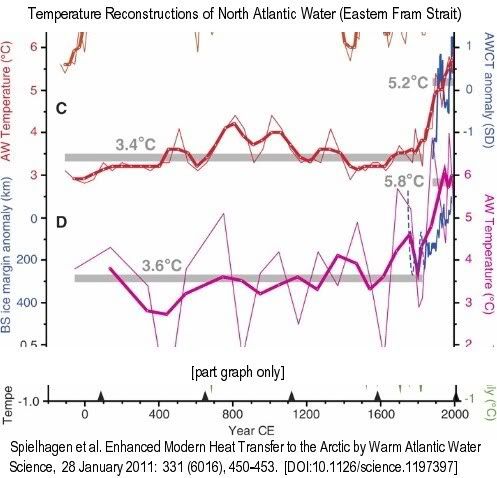 Thin lines are raw data, bold lines are three-point running means…. (C) Summer temperatures at 50-m water depth (red)…. Gray bars mark averages until 1835 CE and 1890 to 2007 CE. Blue line is the normalized Atlantic Water core temperature (AWCT) record … from the Arctic Ocean (1895 to 2002; 6-year averages)…. (D) Summer temperatures (purple) [calculated with a different method]
 |
The IPCC didn't take such feedbacks into account and didn't foresee a total September sea ice loss in the Arctic for this century. Many scientists have repeatedly warned about this, as mentioned in this early 2009
post and this early 2010
post.
Projections that start with more recent data will take some of this feedback into account. Projections that start with 1992 and 1995 data, as in the pink and purple lines on above image, predict a total loss of September Arctic sea ice by 2040 or 2030. A study that used 2007/2008 data as starting point predicts a nearly sea ice free Arctic in September
by the year 2037.
Albedo change is only one of a number of feedback processes. A rapid rise of Arctic temperatures could lead to wildfires and the release of huge amounts of carbon dioxide and methane that are now stored in peat, permafrost and clathrates, which constitutes further feedback that could cause a runaway greenhouse effect. Heat produced by decomposition of organic matter is yet another feedback
that leads to even deeper melting.
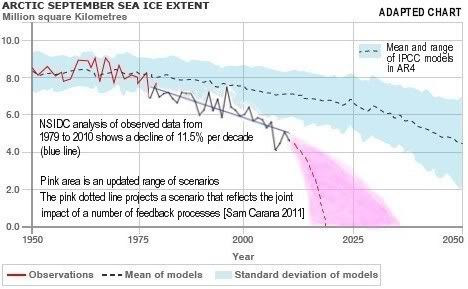
The cumulative impact of multiple feedback processes and their interaction reinforces and accelerates Arctic warming, making downward curved projections more applicable than straight line extrapolation of earlier data. The pink dotted line on above chart shows a scenario that reflects the impact of a number of feedback processes.
A
study at the University of Calgary concludes that, even if we completely stopped using fossil fuels and put no more CO2 in the atmosphere, we've already added enough carbon in the oceans to cause the West Antarctic ice sheet to eventually collapse (by the year 3000), resulting in a global sea level rise of at least four meters. In other words, we have already passed the tipping point for the West Antarctic ice sheet, and additional emissions could cause its collapse to occur much earlier.
According to a
study published in the journal Nature Geoscience, ice and snow in the Northern Hemisphere are now reflecting on average 3.3 watts of solar energy per square meter back to space, a reduction of 0.45 watts per square meter between 1979 and 2008. "The rate of energy being absorbed by the Earth through cryosphere decline – instead of being reflected back to the atmosphere – is almost 30% of the rate of extra energy absorption due to CO2 increase between pre-industrial values and today,"
co-author Karen Shell said.
A
study by by National Center for Atmospheric Research (NCAR) scientist Jeffrey Kiehl found that carbon dioxide may have at least twice the effect on global temperatures than currently projected by computer models of global climate. Melting of ice sheets, for example, leads to additional heating because exposed dark surfaces of land or water absorb more heat than ice sheets.
Without changes, this new study warns, Earth's average temperature appears set to rise this century by
29°F (16°C), to levels never before experienced in human history. Such a rise would make that many areas on Earth would become too hot to live in.
Humans and other mammals cannot survive prolonged exposure to temperatures exceeding 95°F (35°C), says
Steven Sherwood. Heat stress would make many parts of the globe
uninhabitable with global-mean warming of about 7°C (12.6°F). Warming of
about 21°F (11-12°C) would make places where most people now live uninhabitable.
I have made
recommendations to deal with global warming for years, most recently in this
Global Warming Action Plan.
What do you think should be done?
| More on Global Warming:
|
| More on Geoengineering:
|