How much time is there left to act, before methane hydrate releases will lead to human extinction?
by Malcolm Light, edited by Sam Carana
 Figure 1 below looks at the temperature impact of abrupt methane releases, as measured in 2010 in Svalbard (above image). Such emissions are typically triggered by disruption of the integrity of the hydrates holding the methane.

As the red line on the graph indicates, these emissions would raise local temperatures significantly, in a matter of months, since methane has a strong greenhouse effect.
At the time, the rapid increase in methane levels alarmed scientists around the world, but NASA now regards these releases merely as a local peak event that had little impact on overall global temperatures. Even so, the Svalbard event is indicative of the local temperature impact of such emissions.
The IPCC estimates the temperature change at 2090-2099 (relative to 1980-1999) at between 1.8°C (likely range: 1.1°C to 2.9°C) and 4.0°C (likely range: 2.4°C to 6.4°C), depending on the chosen scenario.
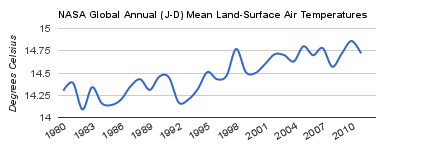
There are several ways to project how much temperatures will rise in future. The chart below shows the global temperature rise from 1980 to 2011, using the most recent NASA data. Clearly, a simple linear extension of this trend would not suffice, as it would ignore the many feedback effects accelerating the rise.

The worst-case IPCC scenario projects a mean temperature rise that would take average global temperature beyond 20 degrees Celsius this century, an obviously catastrophic scenario. Yet, the IPCC scenarios fail to include the many feedbacks that accelerate temperature rises, such as large abrupt releases from methane hydrates. In fact, the IPCC miserably failed to warn about the dramatic loss of Arctic sea ice, as pictured on the chart below, by Wipneus based on PIOMAS data.

Mid-point IPCC projections have been incorporated in Figure 2 below for reference. The diagram also incorporates the warming impact of large methane releases, triggered by a scenario based on the data from Svalbard and by the impact of increased seismic activity in the Arctic.
Above updated global warming extinction diagram was produced using new information from the ice cap melting curve and the measured Svalbard methane concentrations (NOAA 2011a).
While the gradients were calculated in a different way, taking account of existing Arctic temperatures, the result is almost identical to the earlier version. Furthermore, methane would only require to have a global warming potential of 43.5 over 50 years duration (Figure 2, duration from Carana 2011g) to achieve this high temperature increase in the Arctic. The Arctic ice cap heating curves lag behind the expected Arctic atmospheric temperature curves by some 10 to 20 years over the defined extinction period which is probably a result of the extra energy needed for the latent heat of melting of ice as the permafrost, Greenland and Antarctic ice caps melt away (Figure 2).
It is perfectly clear from the graphs that the methane build up in the Arctic is mainly a result of increasing earthquake activity along the Gakkel Ridge caused by global warming induced worldwide expansion of the Earth’s crust due to the carbon dioxide buildup in the atmosphere which is enhanced by the heating up of the Arctic ocean due to the high global warming potential of the methane (Light 2011). This close relationship between the Gakkel Ridge earthquake activity, the destabilisation of the Arctic methane hydrates and the NASA GISS surface temperature anomalies has already been clearly demonstrated (Carana, 2011b; Light 2011).
If I was a medical doctor I would say that the patient has a terminal illness and is expected to die of an extreme fever between 2038 and 2050. There are three actions that have to be taken immediately by world governments, if there is any faint hope of preventing the final excruciating stages of death the human race will be forced to live through as we are all boiled like lobsters.
- Developed (and some developing) countries must cut back their carbon dioxide emissions by a very large percentage (50% to 90%) by 2020 to immediately precipitate a cooling of the Earth and its crust. If this is not done the earthquake frequency and methane emissions in the Arctic will continue to grow exponentially leading to our inexorable demise in 2038 to 2050.
- Geoengineering must be used immediately as a cooling method in the Arctic to counteract the effects of the methane buildup in the short term. However, these methods will lead to further pollution of the atmosphere in the long term and will not solve the earthquake induced Arctic methane buildup which is going to lead to our annihilation.
- The United States and Russia must immediately develop a net of powerful radio beam frequency transmission stations around the Arctic using the critical 13.56 MHZ beat frequency to break down the methane in the stratosphere and troposphere to nanodiamonds and hydrogen (Light 2011a) . Besides the elimination of the high global warming potential methane, the nanodiamonds may form seeds for light reflecting noctilucent clouds in the stratosphere and a light coloured energy reflecting layer when brought down to the Earth by snow and rain (Light 2011a). HAARP transmission systems are able to electronically vibrate the strong ionospheric electric current that feeds down into the polar areas and are thus the least evasive method of directly eliminating the buildup of methane in those critical regions (Light 2011a).
ReferencesIPCC Fourth Assessment Report on Climate Change 2007 - temperature rise projections
ipcc.ch/publications_and_data/ar4/wg1/en/spmsspm-projections-of.html NASA global temperature data
data.giss.nasa.gov/gistemp/tabledata_v3/GLB.Ts.txtArctic Sea Ice yearly minimum volume, with trendline added by
Wipneus, based on data by
Polar Science Center | Applied Physics Laboratory | University of Washington (2011)
http://psc.apl.washington.edu/wordpress/research/projects/arctic-sea-ice-volume-anomaly/Carana, S. (2011b), Light M.P.R. and Carana, S. (2011c)
Methane linked to seismic activity in the Arctic
arctic-news.blogspot.com/p/seismic-activity.htmlLight M.P.R. (2011), Edited by Sam Carana
Use of beamed interfering radio frequency transmissions to decompose Arctic atmospheric methane clouds
arctic-news.blogspot.com/p/decomposing-atmospheric-methane.htmlCarana, S. (2011g)
Runaway Global Warming
geo-engineering.blogspot.com/2011/04/runaway-global-warming.htmlHansen, J.E. (2011)
GISS Surface Temperature Analysis. NASA. Goddard Institute for Space Physics
data.giss.nasa.gov/cgibin/gistemp/do_nmap.py?year_last=2011&month_last=08&sat=4&sst=1&type=anoms&mean_gen=02&year1=2009&year2=2009&base1=1951&base2=1980&radius=1200&pol=polIPPC (2007)
Fourth Assessment Report on Climate Change 2007. FAO 3.1, Figure 1, WG1, Chapter 3, p. 253.
blogs.ei.colombia.edu/wp-content/uploads/2010/12/graph-2-600X422.jpgLight M.P.R. (2011)
Global Warming
globalwarmingmlight.blogspot.comMasters. J. (2009)
Top Climate Story of 2008
www.wunderground.com/blog/JeffMasters/comment.html?entrynum=1177NOAA (2011a), generated ESRL/GMO – 2010, November 08, 11:12 am
Huge sudden atmospheric methane spike Arctic Svalbard (north of Norway)
The need for geo-engineeringNOAA (2011b), generated ESRL/GMO – 2011, December 14, 17:21 pm
Huge sudden methane spike recorded at Barrow (BRW), Alaska, United States.
The need for geo-engineering

